
Test a decision with What-if
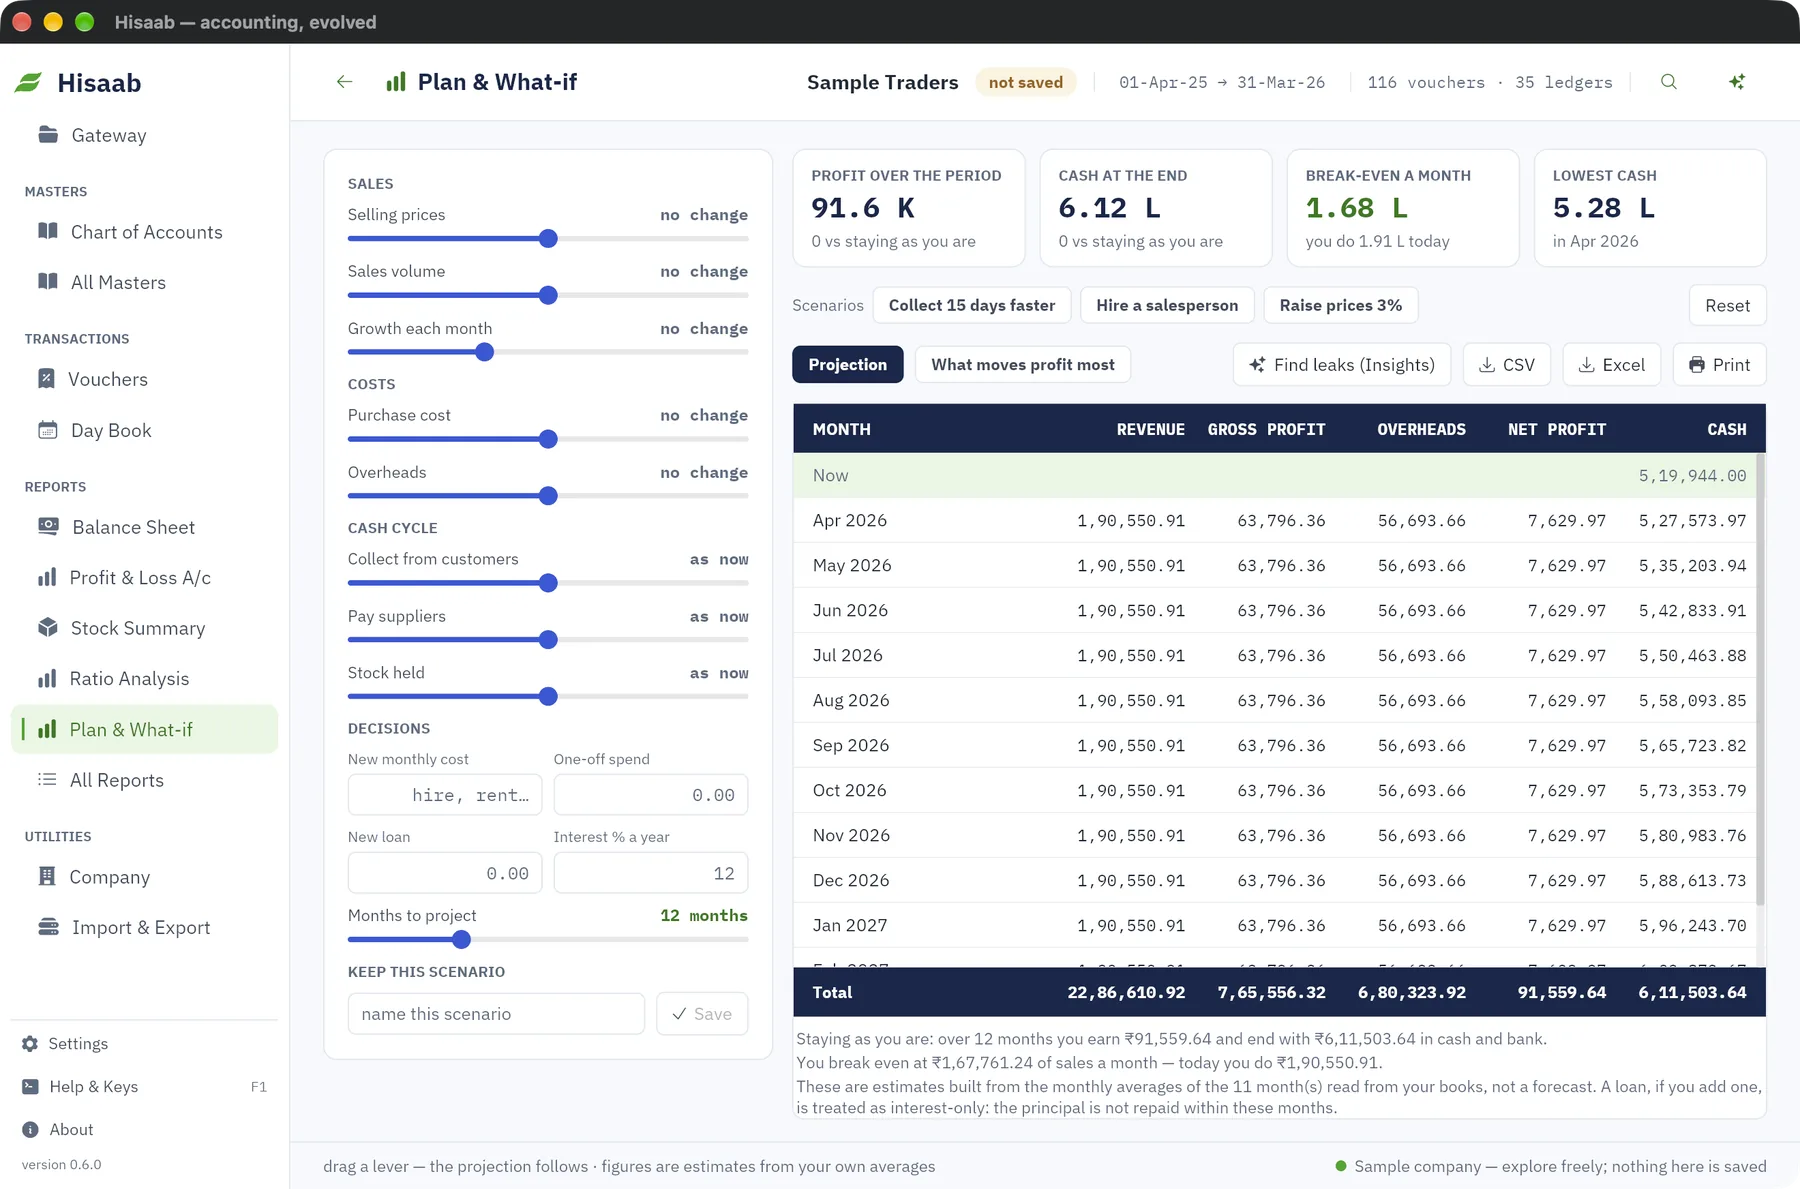
Move the levers on the Plan & What-if screen to see what a change would do to profit and cash, month by month.
Plan & What-if takes the monthly averages of your own books and projects them forward. Move a lever and the projection changes at once. Nothing on this screen posts an entry.
Where the starting figures come from#
Click Plan & What-if in the sidebar. Hisaab reads the period shown at the top of the screen and works out, per month: sales, cost of goods sold, each overhead and other income. It also takes the closing cash and bank balance, and the days you take to collect, to pay, and to hold stock.
To use a different period, open any report, press F2, set the period, and come back to this screen.
Only months that have entries are averaged. The projection starts from the month after the period ends, or after today if the period runs past today.
The levers#
| Lever | Range | What it changes |
|---|---|---|
| Selling prices | −20% to +20% | Sales value, with cost unchanged |
| Sales volume | −50% to +50% | Sales and cost of goods together |
| Growth each month | −5% to +10% | Compound growth of sales and cost from month 2 |
| Purchase cost | −20% to +20% | Cost of goods sold |
| Overheads | −50% to +50% | All indirect expenses |
| Collect from customers | 60 days faster or slower | Cash tied up in receivables |
| Pay suppliers | 60 days later or sooner | Cash held back from payables |
| Stock held | 60 days less or more | Cash tied up in stock |
Under Decisions, type amounts:
- New monthly cost: a hire, rent or any cost added every month.
- One-off spend: charged in month 1 only.
- New loan and Interest % a year: the loan amount is added to cash in month 1, and one month's interest is charged every month.
Months to project runs from 3 to 36. It is 12 unless you change it.
Read the result#
Four cards sit above the table.
| Card | Meaning |
|---|---|
| Profit over the period | Total net profit, and the difference from staying as you are |
| Cash at the end | Closing cash and bank, and the difference from staying as you are |
| Break-even a month | Monthly sales needed to cover costs. It shows "none" when sales do not cover their own cost. |
| Lowest cash | The lowest month-end balance, and the month cash runs out if it does |
Below the cards, Projection shows each month: Revenue, Gross profit, Overheads, Net profit and Cash. A month with negative cash is shown in red.
What moves profit most shows seven standard steps, such as a 1% price rise or collecting 15 days faster, each tried alone over 12 months, strongest first.
Save a scenario#
- Set the levers.
- Type a name in name this scenario.
- Click Save. Accountant or Admin access is needed.
Saved scenarios appear as buttons beside Scenarios. Click one to load it. The screen shows the first four. Reset puts every lever back to today's position.
Ready-made scenarios#
Every company has three ready-made scenarios beside Scenarios:
| Button | What it sets |
|---|---|
| Raise prices 3% | Selling prices +3%, over 12 months |
| Collect 15 days faster | Collect from customers 15 days faster, over 12 months |
| Hire a salesperson | New monthly cost ₹25,000 and sales volume +8%, over 12 months |
Click one to set the levers. They are part of the app, not of your books: clicking one saves nothing, and a Viewer can use them. To keep your own version, change the levers and click Save. A scenario saved under the same name takes the place of the ready-made button.
What the projection assumes#
- The figures are estimates from your monthly averages. They are not a forecast.
- Every month looks like the average month. Seasons are not modelled.
- A loan is interest-only. The principal is not repaid within the projected months.
- A days lever releases or absorbs cash once, as receivables, payables or stock settle at the new level. It does not change profit.
- Overheads stay fixed when volume changes. Other income stays as it is.
Next#
Something here wrong or missing? Open a ticket and mention this page.